
Segmentation
Dashboard
For segmentation tasks, average IoU and agreement are shown.
Average IOU
Average intersection-over-union, or IoU, for a task is the IoU between each case’s Majority Label and the Correct Label, averaged across all of Gold Standard cases where the Centaur labelers have reached consensus. This is only provided for polygon, pixel, box, and circle segmentation tasks - not line segmentation tasks.
IoU for two shapes is the area of their overlap divided by their combined area. The more closely two shapes overlap, the higher the IoU.

If the Majority Label and Correct Label each contain multiple shapes, the IoU between the two is calculated the same way: the intersection between the union of the Majority Label shapes and the union of the Correct Label shapes, divided by the union of all Majority Label and Correct Label shapes. Also, if both labels contain no shapes (i.e. both are No Findings), then the IoU is defined to be 1 (i.e. perfect match).
In a multi-frame task, the IoUs are first calculated at a frame level, then all frames are averaged to create a case level IoU.
Average F1
Average F1 score for a task is the F1 score between each case’s Majority Label and the Correct Label averaged across all of the Gold Standard cases where the Centaur labelers have reached consensus. This is provided for only line segmentation tasks. Read more about how F1 scores are calculated here.
Agreement
Read about the case-level definition of agreement.
Task-level agreement is calculated by averaging the agreement scores of all the Gold Standard and Labeled cases in the task.
Charts and Tables
Confusion Matrix
For segmentation tasks, the confusion matrix shows if the presence or absence of a finding per case match between the Centaur labelers’ answers and the Correct Labels on the Gold Standard cases where our labelers have reached a consensus.
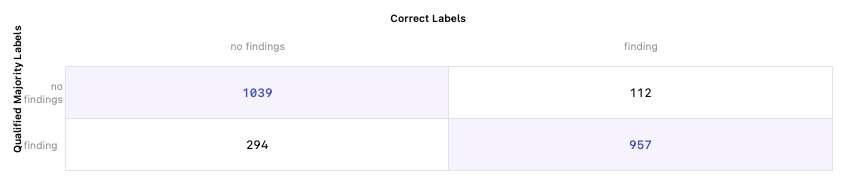
Here, out of all Gold Standard cases with at least one finding in the Correct Label, 957 also had a Majority Label with at least one finding. 112 of the Gold Standard cases with at least one finding in the Correct Label a Majority Label of 0 findings.
The confusion matrix for segmentation tasks can show how well the labelers are at detecting findings, when compared to the Gold Standard cases. When investigating accuracy of the labels, we recommend looking at the task level metrics and/or conducting a case-by-case review.
Read about matrices for multi-class segmentation here.
Label distribution
The label distribution bar graph shows the breakdown of Gold Standard cases by class versus Labeled cases. The label distribution graph can be used to assess whether the class breakdown is consistent with your expectations if known.
Labeling rate
The labeling rate chart shows how many total cases were labeled by a given day. This chart will only include dates where contests were running, as that’s when cases move to Labeled.
Per-class Metrics
For multi-class segmentation tasks we provide per-class metrics. This includes either the average IoU or F1, depending on the type of segmentation, for each label class.